View and filter reports
The Reports dashboard is where you monitor how your business is doing — reservations, revenue, taxes, and more — for any time period and any set of venues. It's a read-only overview; when you need the underlying rows in a spreadsheet, you export from the same page.
Open the dashboard
Go to Reports
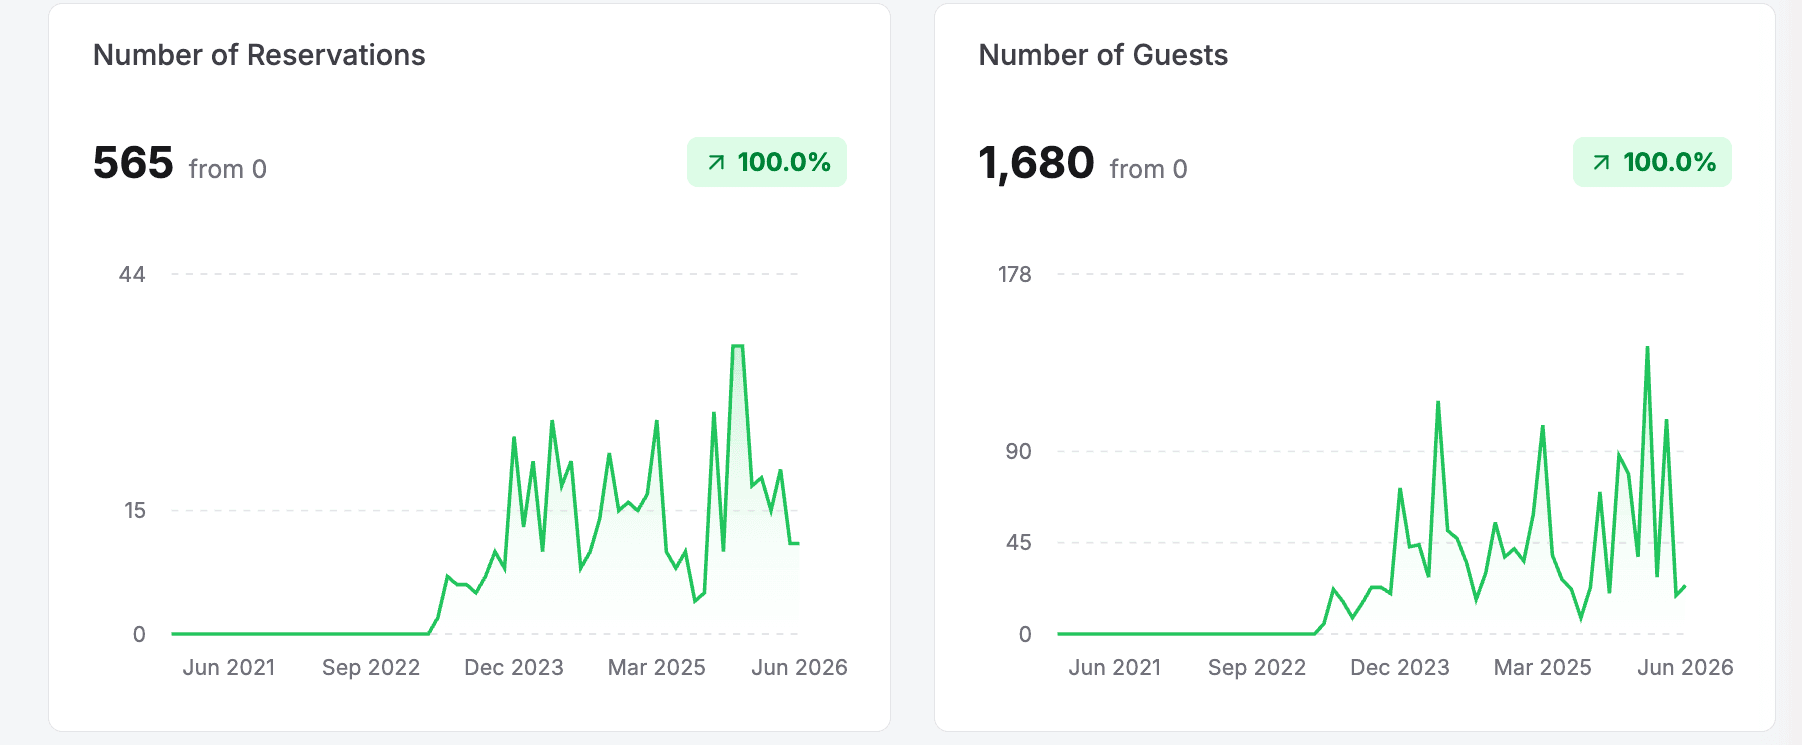
The dashboard loads a grid of metric cards. Each card shows a total for the selected period, a comparison to the previous period of the same length, a trend indicator (green when the metric is up, red when it's down), and a small chart of the metric over time.
The dashboard is for viewing on screen — the cards themselves can't be downloaded. To pull the underlying reservations into a spreadsheet, use the Export button — see Export report data.
The four report tabs
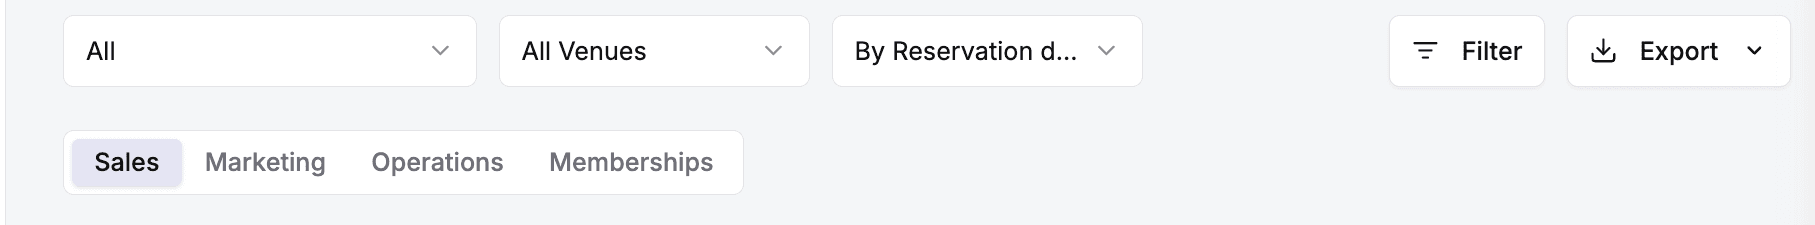
Reports is split into four tabs across the top — Sales, Marketing, Operations, and Memberships. Switch tabs to see a different set of metric cards; the time period, venue, and filters you set carry across all of them.
The Sales tab is the default and carries the metrics most venues check daily:
| Field | Description |
|---|---|
| Number of Reservations | Bookings in the period. |
| Number of Guests | Total guests across those bookings. |
| Revenue Booked | Revenue from reservations made in the period. |
| Revenue Collected | Money actually collected in the period. |
| Refunds | Amount refunded. |
| Cancellations | Cancelled reservations. |
| Taxes Collected | Tax collected across reservations. |
| Fees Collected | Service and other fees collected. |
| Revenue by Categories | Revenue split across your revenue categories, shown as a horizontal bar chart rather than a single total. |
| Revenue by Packages | Revenue split across your packages, shown as a horizontal bar chart. |
Marketing
How guests find and book you, and how your promotions perform:
| Field | Description |
|---|---|
| New Customers | First-time guests who booked in the period. |
| Discount Redemptions | How many times discount codes were redeemed. |
| Top Discount Codes | Your most-used codes, as a bar chart. |
| Revenue by Discount Code | Revenue tied to each discount code. |
| Bookings | Bookings broken down by marketing attribution — switch the Group by control between Source, Medium, and Campaign. |
| Revenue | Revenue broken down by the same Source / Medium / Campaign attribution. |
Operations
Day-to-day operational patterns across your venues:
| Field | Description |
|---|---|
| Avg Days Out | Average lead time between when a booking is made and the reservation date. |
| Avg Guests | Average party size per reservation. |
| No Shows | Reservations where the guest didn't show up. |
| Heat Map | A day-of-week by time-of-day grid of how busy you are, by reservations or guests — switch the metric and time range to spot your peak periods. |
| Resource Usage | How heavily your resources are used across the day's time slots. |
Memberships
For venues that sell membership plans (this tab hides the venue, date-mode, Filter, and Export controls):
| Field | Description |
|---|---|
| Active Members | Members with an active plan. |
| New Members | Members who joined in the period. |
| Churned | Members lost in the period. |
| MRR | Monthly recurring revenue from memberships, charted over time. |
| ARR | Annual recurring revenue from memberships. |
| Revenue by Plan | Membership revenue split across your plans. |
| Active Members by Plan | How many active members each plan has. |
Filter your reports
Controls at the top of the page shape what every card (and every export) is based on. Set them before reading the numbers or exporting. Which controls appear depends on the tab — the time period is always available, while the venue, date mode, and Filter / Export controls are hidden on the Memberships tab.
Set the time period
Click the time-period dropdown (default: All) and pick a preset: Today, This week, Last week, This month, Last 30 days, Last month, Last 3 months, Last 6 months, Year to date, Last year, All, or Custom. Choose Custom to set an exact start and end date. The time period is available on every tab.
Filter by venue
Click the venue dropdown and choose All Venues, or select one or more specific venues to narrow the report to just those locations. Available on every tab except Memberships.
Set the date mode
Choose how reservations are counted into the period. By Reservation date counts each booking on the date the reservation is for; By Created date counts it on the date the booking was made. Use Reservation date for operational views and Created date to see when sales actually came in. This control appears on the Sales and Marketing tabs only.
Apply advanced filters
Click Filter to open the filter panel and add one or more conditions to narrow the data further. Conditions combine to refine which reservations are included. The Filter button is available on every tab except Memberships.
You can filter on any of these fields:
| Field | Description |
|---|---|
| Reservation Date | When the reservation is scheduled for. |
| Reservation Created Date | When the booking was made. |
| Guests | Number of guests (equals, greater than, less than, and similar). |
| Duration | Length of the reservation. |
| Start Time | Is after, is before, or is on a given time. |
| Reservation Number | Match a specific reservation number. |
| Card Last 4 | The last four digits of the payment card. |
| Payment Status | Filter by payment state. |
| Check In Status | Filter by whether guests are checked in. |
Once your filters show the data you want, you can pull it out as a spreadsheet — every export reflects the filters set here. See Export report data for the five export types and exactly what each one contains.
Updated Jun 24, 2026
Was this helpful?